Data Analysis in Medical Device and Pharmaceutical Quality Management Systems
Introduction
Regulatory authorities worldwide, including the FDA, EMA, and other international bodies, require pharmaceutical and medical device manufacturers to employ statistical methods and data analysis in their quality management systems. Understanding why data analysis is essential and how to apply it appropriately is fundamental to regulatory compliance and effective quality assurance.
Regulatory authorities worldwide, including the FDA, EMA, and other international bodies, require pharmaceutical and medical device manufacturers to e…
Why Do We Collect Data?
The primary purpose of data collection is to conduct quality assurance activities based on “evidence” rather than “intuition” or subjective impressions. This evidence-based approach ensures that decisions are grounded in objective reality rather than personal perceptions or assumptions.
Consider these two scenarios:
The first scenario represents a proper, data-driven approach where specific evidence supports the prioritization of corrective actions. The complaint data has been systematically collected, analyzed, and ranked to identify the top three causes, providing a clear rationale for resource allocation.
In contrast, the second scenario relies on subjective impressions such as “it feels like,” “lately,” and “I’ve been seeing,” which lack quantitative foundation. Acting on such impressions without statistical verification may result in misdirected efforts, wasted resources, and failure to address the actual root causes of quality issues. Organizations operating under this approach risk implementing ineffective countermeasures that do not resolve the underlying problems.
Statistical analysis transforms subjective observations into objective evidence, enabling organizations to make informed decisions about where to focus improvement efforts for maximum impact.
What Is Data?
Data refers to raw, unorganized information, often called “raw data.” In its original form, data typically consists of numerical values, measurements, observations, or records that have not yet been processed or interpreted. Because data is unorganized, it is difficult for the human mind to comprehend or extract meaningful insights directly from it. A spreadsheet containing thousands of rows of numerical measurements, for example, provides little immediate understanding of trends, patterns, or relationships.
To make data useful, it must be transformed into “Information” through systematic processing and organization. This transformation requires the application of statistical methods, analytical techniques, and visualization tools.
The DIKW Pyramid: From Data to Wisdom
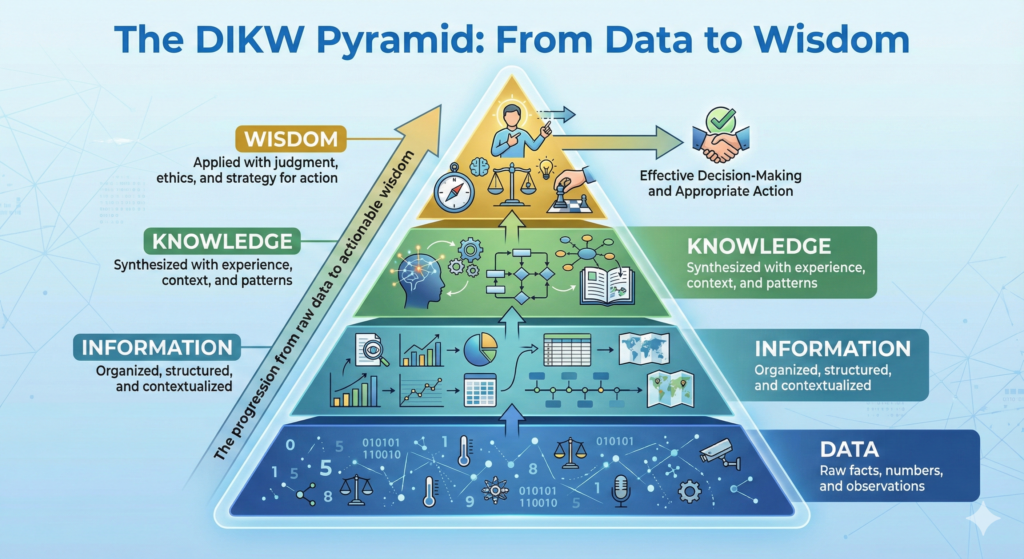
The progression from raw data to actionable wisdom follows a hierarchical model known as the DIKW Pyramid (Data-Information-Knowledge-Wisdom):
Data → The foundation layer consists of raw facts, numbers, and observations collected through various means. Data alone provides no context or meaning.
Information → When data is organized, structured, and contextualized, it becomes information. Statistical analysis, categorization, and visualization convert data into information that humans can understand and interpret.
Knowledge → Information synthesized with experience, understanding of context, and recognition of patterns becomes knowledge. Knowledge represents a deeper level of comprehension about what the information means and how it relates to other information.
Wisdom → At the apex of the pyramid, knowledge applied with judgment, ethical considerations, and strategic thinking becomes wisdom. Wisdom enables effective decision-making and appropriate action based on the complete understanding of the situation.
This transformation process is essential for quality management systems, as regulatory compliance and continuous improvement require not just data collection, but the systematic conversion of that data into actionable wisdom that drives better outcomes.
Why Are Statistical Methods Necessary?
Statistical methods serve as the essential bridge between incomprehensible raw data and human understanding. The primary function of statistics in quality management is to visualize and summarize data in ways that make patterns, trends, and relationships apparent to human observers.
Through statistical processing and visualization techniques such as charts, graphs, control charts, and summary statistics, numerical data becomes interpretable. Rather than attempting to mentally process thousands of individual data points, decision-makers can quickly grasp the essential characteristics of the data through properly designed statistical presentations.
Two Categories of Statistics
Statistical methods employed in quality management systems can be classified into two fundamental categories:
Descriptive Statistics
Descriptive statistics involves collecting data and using tables, graphs, and summary measures to characterize and understand the data’s features and patterns. This approach focuses on describing what is actually observed in the collected data.
Common applications in quality management include monitoring process conditions through control charts, tracking complaint rates and nonconformance rates over time using trend analysis, and identifying the distribution and frequency of complaint causes through Pareto analysis. Descriptive statistics answers questions such as: What is happening? What are the current trends? Which problems occur most frequently?
Descriptive statistical techniques include measures of central tendency such as mean, median, and mode; measures of variability including range, standard deviation, and variance; and graphical representations like histograms, run charts, control charts, Pareto diagrams, and scatter plots.
Inferential Statistics
Inferential statistics involves drawing samples from a population and using the characteristics of those samples to make inferences about the entire population. This approach also includes hypothesis testing to determine whether observed differences or relationships are statistically significant or could have occurred by chance.
Applications in quality management include acceptance sampling in incoming inspection where samples are tested to infer the quality of entire lots, design verification activities where sample testing is used to validate that design requirements are met across all production, and process validation where samples demonstrate that the manufacturing process consistently produces conforming product.
Inferential statistical techniques include sampling plans based on statistical rationale (such as those described in ISO 2859 or MIL-STD-105), hypothesis testing methods including t-tests and ANOVA, confidence intervals that quantify the uncertainty in estimates, and process capability studies using Cp and Cpk indices to assess whether processes can consistently meet specifications.
The distinction between these two categories is important because they serve different purposes and require different levels of statistical rigor. Descriptive statistics help organizations understand their current state, while inferential statistics help them make decisions and predictions with quantifiable confidence levels.
Regulatory Requirements for Statistical Methods
FDA Quality System Regulation (21 CFR Part 820.250)
The FDA’s Quality System Regulation, which has governed medical device manufacturing since 1996, includes a specific section dedicated to statistical techniques. Section 820.250 states:
“(a) Where appropriate, each manufacturer shall establish and maintain procedures for identifying valid statistical techniques required for establishing, controlling, and verifying the acceptability of process capability and product characteristics.
(b) Sampling plans, when used, shall be written and based on a valid statistical rationale. Each manufacturer shall establish and maintain procedures to ensure that sampling methods are adequate for their intended use and to ensure that when changes occur the sampling plans are reviewed. These activities shall be documented.”
The regulation emphasizes two critical requirements. First, manufacturers must use “appropriate” and “valid” statistical techniques. The appropriateness depends on the specific application and the type of data being analyzed. Second, when sampling plans are employed, they must be based on valid statistical rationale, not arbitrary choices or convenience.
Historical Context: The FDA’s Concerns About Misuse
The importance of proper statistical application is further emphasized in the FDA’s Federal Register publication from October 7, 1996 (Volume 61, Number 195), which accompanied the Quality System Regulation. The FDA specifically addressed concerns about statistical methods in two important statements:
First, regarding recurring quality problems, the FDA stated: “For the detection of recurring quality problems, use ‘appropriate statistical methods.’ The FDA emphasizes that when statistical methods need to be used, appropriate statistical tools should be employed.”
Second, and more critically, the FDA noted: “The FDA has often witnessed manufacturers using incorrect statistics. Manufacturers were using statistical methods to minimize their efforts rather than to address problems. Such misuse of statistics constitutes a violation of this section (820.100).”
These statements reveal a pattern the FDA observed: some manufacturers were applying statistical methods superficially to create an appearance of compliance, rather than genuinely using statistics to identify and solve quality problems. This misuse included selecting sample sizes too small to detect meaningful differences, choosing statistical tests that lacked the power to identify real problems, interpreting results selectively to support desired conclusions rather than objective truth, and failing to investigate statistically significant findings.
This historical context explains why regulatory inspectors scrutinize not just whether statistical methods are used, but whether they are used correctly and with genuine intent to ensure product quality and safety.
ISO 13485:2016 Requirements
ISO 13485:2016, the international standard for medical device quality management systems, incorporates statistical requirements throughout multiple sections, reflecting the global harmonization of quality system expectations.
Section 7.3.6 (Design and Development Verification): Organizations must document verification plans that include methods, acceptance criteria, and as appropriate, statistical techniques with rationale for sample size. This requirement ensures that design verification activities are conducted with sufficient statistical rigor to demonstrate that design outputs meet design inputs.
Section 7.3.7 (Design and Development Validation): Similarly, validation plans must include methods, acceptance criteria, and as appropriate, statistical techniques with rationale for sample size. Design validation must be conducted on representative product including initial production units, batches, or their equivalents.
Section 7.5.6 (Validation of Processes for Production and Service Provision): The procedures for validation must document, as appropriate, statistical techniques with rationale for sample sizes. This ensures that process validation demonstrates with statistical confidence that manufacturing processes can consistently produce conforming product.
Section 8.1 (General requirements for Measurement, Analysis, and Improvement): Organizations must determine appropriate methods, including statistical techniques, for monitoring and measurement of quality management system processes.
Section 8.4 (Analysis of Data): The procedure for data analysis shall include determination of appropriate methods, including statistical techniques and the extent of their use.
The phrase “as appropriate” appears throughout these requirements, indicating that while statistical methods are not always mandatory, organizations must make a conscious, documented decision about when statistical techniques are appropriate and provide rationale for their choices. Simply stating that statistical methods are not needed without justification is insufficient to meet regulatory expectations.
FDA Quality Management System Regulation (QMSR) – Effective February 2, 2026
The FDA published a final rule on February 2, 2024, amending the Quality System Regulation to create the new Quality Management System Regulation (QMSR), which becomes effective February 2, 2026. This represents the most significant update to FDA medical device quality system requirements in nearly three decades.
The QMSR incorporates by reference ISO 13485:2016 as the foundation for quality management system requirements, while adding specific FDA requirements to ensure consistency with U.S. law and regulations. This harmonization effort aligns FDA requirements more closely with international standards used by regulatory authorities worldwide, facilitating global market access for medical device manufacturers.
Key aspects of the QMSR relevant to statistical methods include:
Incorporation of ISO 13485:2016 Statistical Requirements: All statistical method requirements from ISO 13485:2016 are now explicitly part of FDA requirements, including those related to design verification and validation, process validation, and data analysis.
Definitions: The QMSR incorporates definitions from ISO 13485:2016 and ISO 9000:2015, including quality management terminology related to statistical techniques and data analysis.
Risk-Based Approach: The QMSR emphasizes risk management throughout the product lifecycle, which inherently requires appropriate statistical methods to assess and control risks based on objective data rather than subjective judgment.
Inspection Changes: FDA will implement a new inspection process aligned with QMSR requirements, replacing the Quality System Inspection Technique (QSIT). FDA inspectors will now review management reviews, internal audit reports, and supplier audit reports, which were previously exempt from routine inspection.
Manufacturers must comply with QMSR by February 2, 2026. This requires a gap analysis comparing current practices against ISO 13485:2016 and QMSR requirements, implementation of any necessary changes to quality management system documentation and procedures, training of personnel on new requirements and methodologies, and internal audits to verify compliance before the effective date.
Data Integrity and the ALCOA+ Principles
Modern regulatory expectations extend beyond simply collecting and analyzing data to ensuring the integrity, reliability, and traceability of that data throughout its lifecycle. The concept of data integrity has evolved significantly, particularly with the increasing use of electronic systems and computerized data management.
ALCOA+ Principles
The FDA introduced the ALCOA principles in the 1990s as fundamental requirements for data integrity. These principles have since been expanded to ALCOA+ and further to ALCOA++, representing the evolution of data integrity expectations.
Original ALCOA Principles:
Attributable: Every piece of data must be attributable to the specific individual, system, or instrument that created or modified it. This requires unique user identifications, no shared passwords, and complete audit trails showing who performed each action and when.
Legible: Data must be recorded in a clear, readable manner that prevents misinterpretation. This applies to both handwritten records and electronic data displays. Data should be recorded in a durable medium that maintains legibility over the required retention period.
Contemporaneous: Data must be recorded at the time the work is performed or the observation is made, not reconstructed from memory later. Time stamps on electronic records must accurately reflect when actions occurred, and manual records should be completed immediately during the activity.
Original: The original record or a true copy must be retained. For electronic records, the original electronic data must be preserved, not just printouts. Changes to original data must be documented through controlled processes with complete audit trails.
Accurate: Data must be free from errors and accurately represent what was observed or measured. This requires properly calibrated instruments, validated analytical methods, and documented procedures for data entry and verification. Any corrections must be documented with the reason for the change and approval.
ALCOA+ Additions:
Complete: All data must be captured and retained. No selective data reporting or deletion of unfavorable results is permitted. If data is collected by a system, all of that data must be retained and available for review, including metadata, audit trails, and system logs.
Consistent: Data must be recorded in chronological order with accurate sequencing. Time stamps must be consistent and synchronized across systems. Changes to data must maintain consistency with related data and documentation.
Enduring: Data must be recorded on media that ensures its availability and integrity throughout the required retention period. This includes appropriate backup systems, protection against data corruption, and plans for technology migration to prevent data loss due to obsolete systems.
Available: Data must be readily accessible when needed for review, audit, or inspection throughout its lifecycle. This requires proper indexing, search capabilities, and disaster recovery procedures to ensure data remains available even after system failures or disasters.
These principles apply equally to paper-based records, electronic records, and hybrid systems. They are embedded in FDA regulations (21 CFR Part 11 for electronic records and signatures), EMA guidelines, WHO guidance documents, and other international regulatory frameworks.
Regulatory Guidance on Data Integrity
Several key guidance documents elaborate on data integrity expectations:
The FDA’s “Data Integrity and Compliance with Drug CGMP: Questions and Answers” guidance (December 2018) provides detailed expectations for pharmaceutical manufacturers but applies broadly to all regulated industries. The EMA/MHRA “GMP Data Integrity Definitions and Guidance for Industry” (March 2018, revised 2021) offers parallel guidance for European manufacturers. ISPE‘s “GAMP Guide: Records and Data Integrity” (March 2017) provides practical implementation strategies for the life sciences industry.
Organizations must implement data governance programs that include policies defining roles and responsibilities for data management, procedures for data lifecycle management from creation through archival, risk assessments identifying vulnerabilities in data integrity, controls appropriate to the risks identified, and regular audits to verify ongoing compliance with data integrity requirements.
Risk-Based Approach to Statistical Methods
Both ISO 13485:2016 and the QMSR emphasize a risk-based approach to quality management, which extends to decisions about statistical methods. Organizations must consider the risk associated with their products and processes when determining the appropriate extent and rigor of statistical analysis.
Factors in Risk-Based Decisions
Device Classification and Risk: Higher-risk devices (Class III implantable devices) generally require more rigorous statistical validation than lower-risk devices (Class I general controls devices). However, even low-risk devices require appropriate statistical rigor when critical quality attributes or safety issues are involved.
Process Complexity: More complex manufacturing processes with greater variability require more sophisticated statistical process control and validation approaches. Simple, well-controlled processes may require less elaborate statistical methods while still meeting regulatory requirements.
Clinical Impact of Failure: When product failure could result in serious injury or death, statistical methods must provide high confidence that specifications will be consistently met. This may require larger sample sizes, more frequent monitoring, and tighter control limits.
Process Capability and Historical Performance: Processes with demonstrated capability and stable performance may require less intensive statistical monitoring than new or marginally capable processes. However, this must be demonstrated through objective statistical evidence, not assumed.
Regulatory Requirements: Some regulatory frameworks specify particular statistical approaches for specific applications, such as sterilization validation or biocompatibility testing. These requirements take precedence over general risk-based decision-making.
Documenting the Rationale
A critical requirement across all modern quality standards is documenting the rationale for statistical decisions. Organizations must provide clear explanations for why particular sample sizes were chosen, why certain statistical methods were selected over alternatives, why certain processes require statistical validation while others do not, and how the chosen approach provides adequate assurance of quality and safety.
This documentation serves multiple purposes: demonstrating thoughtful decision-making rather than arbitrary choices, providing evidence of compliance during regulatory inspections, enabling effective knowledge transfer when personnel change, and supporting continuous improvement by making the basis for decisions explicit and reviewable.
Modern Application of Statistical Methods
Integration with Quality Management Systems
Statistical methods should be integrated throughout the quality management system rather than applied in isolation. This integration includes:
Process Design: Using design of experiments (DOE) and other statistical techniques during process development to understand process parameters and optimize performance. Statistical tolerance analysis ensures that component variations will not cause final product failures.
Process Validation: Employing appropriate statistical methods to demonstrate that processes are capable of consistently producing conforming product. This includes process capability studies, statistical acceptance criteria, and ongoing process monitoring.
Process Monitoring: Implementing statistical process control (SPC) using control charts to detect process changes before they result in nonconforming product. Trend analysis identifies gradual deterioration that might not trigger specification limits but indicates loss of process control.
Product and Process Improvement: Using statistical problem-solving tools such as design of experiments, regression analysis, and hypothesis testing to identify root causes and validate the effectiveness of corrective and preventive actions. Data-driven decision making replaces trial-and-error approaches.
Supplier Management: Applying statistical methods to incoming inspection, supplier performance monitoring, and supplier qualification. Statistical evidence of supplier capability reduces the burden of incoming inspection while maintaining quality assurance.
Digital Transformation and Data Analytics
Modern quality management increasingly leverages advanced data analytics, artificial intelligence, and machine learning technologies. While these sophisticated tools offer powerful capabilities, they must still be validated and applied appropriately according to regulatory requirements.
Organizations implementing advanced analytics must ensure transparency and interpretability so that results can be explained to regulators and stakeholders, validation that the algorithms perform correctly and reliably, data integrity throughout the data pipeline from collection through analysis, and documentation of the statistical basis for algorithms and their intended use and limitations.
The principles of appropriate statistical methods, valid statistical rationale, and data integrity apply equally to traditional statistical methods and modern advanced analytics approaches.
Conclusion
Data analysis through appropriate statistical methods is not merely a regulatory requirement but a fundamental tool for ensuring medical device and pharmaceutical product quality and safety. The evolution from the original FDA QSR through ISO 13485:2016 to the new QMSR reflects increasingly sophisticated understanding of how statistical methods contribute to effective quality management.
Organizations must move beyond checkbox compliance to genuine integration of statistical thinking throughout their operations. This requires investment in statistical training for personnel at all levels, implementation of validated systems for data collection and analysis, establishment of clear procedures for statistical method selection and application, documentation of statistical rationales for key decisions, and fostering a culture that values evidence-based decision making.
The regulatory landscape continues to evolve, with increasing emphasis on data integrity, risk-based approaches, and international harmonization. Organizations that develop robust capabilities in statistical methods and data analysis will be well-positioned not only for regulatory compliance but for genuine continuous improvement in product quality and business performance.
As we approach the February 2, 2026 QMSR effective date, manufacturers should view this transition not as a burden but as an opportunity to enhance their quality management systems, align with international best practices, and ultimately deliver safer, more effective products to patients who depend on them.
Key Takeaways for Practitioners
Understanding the purpose of data collection as providing evidence rather than supporting preconceptions is essential for effective quality management. Organizations should invest in appropriate statistical tools and training proportionate to the complexity of their products and processes. Risk-based approaches should guide decisions about statistical rigor while maintaining documentation of rationales to demonstrate thoughtful decision-making.
Data integrity through ALCOA+ principles must be embedded in all data collection and analysis activities. Organizations must prepare for the QMSR transition by February 2, 2026 through gap analysis and systematic implementation. Statistical methods should be integrated throughout the product lifecycle from design through post-market surveillance, recognizing that modern advanced analytics must meet the same standards of validation and documentation as traditional statistics.
Most importantly, organizations should foster a culture where statistical evidence drives decisions rather than subjective impressions or organizational politics. Only through this fundamental shift in mindset can statistical methods fulfill their intended purpose of ensuring product quality and patient safety.
Related FDA QMSR Templates
Streamline your FDA QMSR compliance with our professionally crafted templates:
Related Articles
- The Importance of Data Analysis: The Foundation of Quality Assurance in Medical Device and Pharmaceutical Companies
- Understanding Quality Systems in Pharmaceutical and Medical Device Industries
- Complaint Management in Medical Device Quality Systems
- Proper Japanese Translation of “Review” in Medical Device Regulatory Requirements: Clarifying Terminology in Quality Management Systems
- Quality Management Systems in Medical Device Regulation
- Understanding Risk in Quality Management: A Conceptual Framework for Pharmaceutical and Medical Device Industries