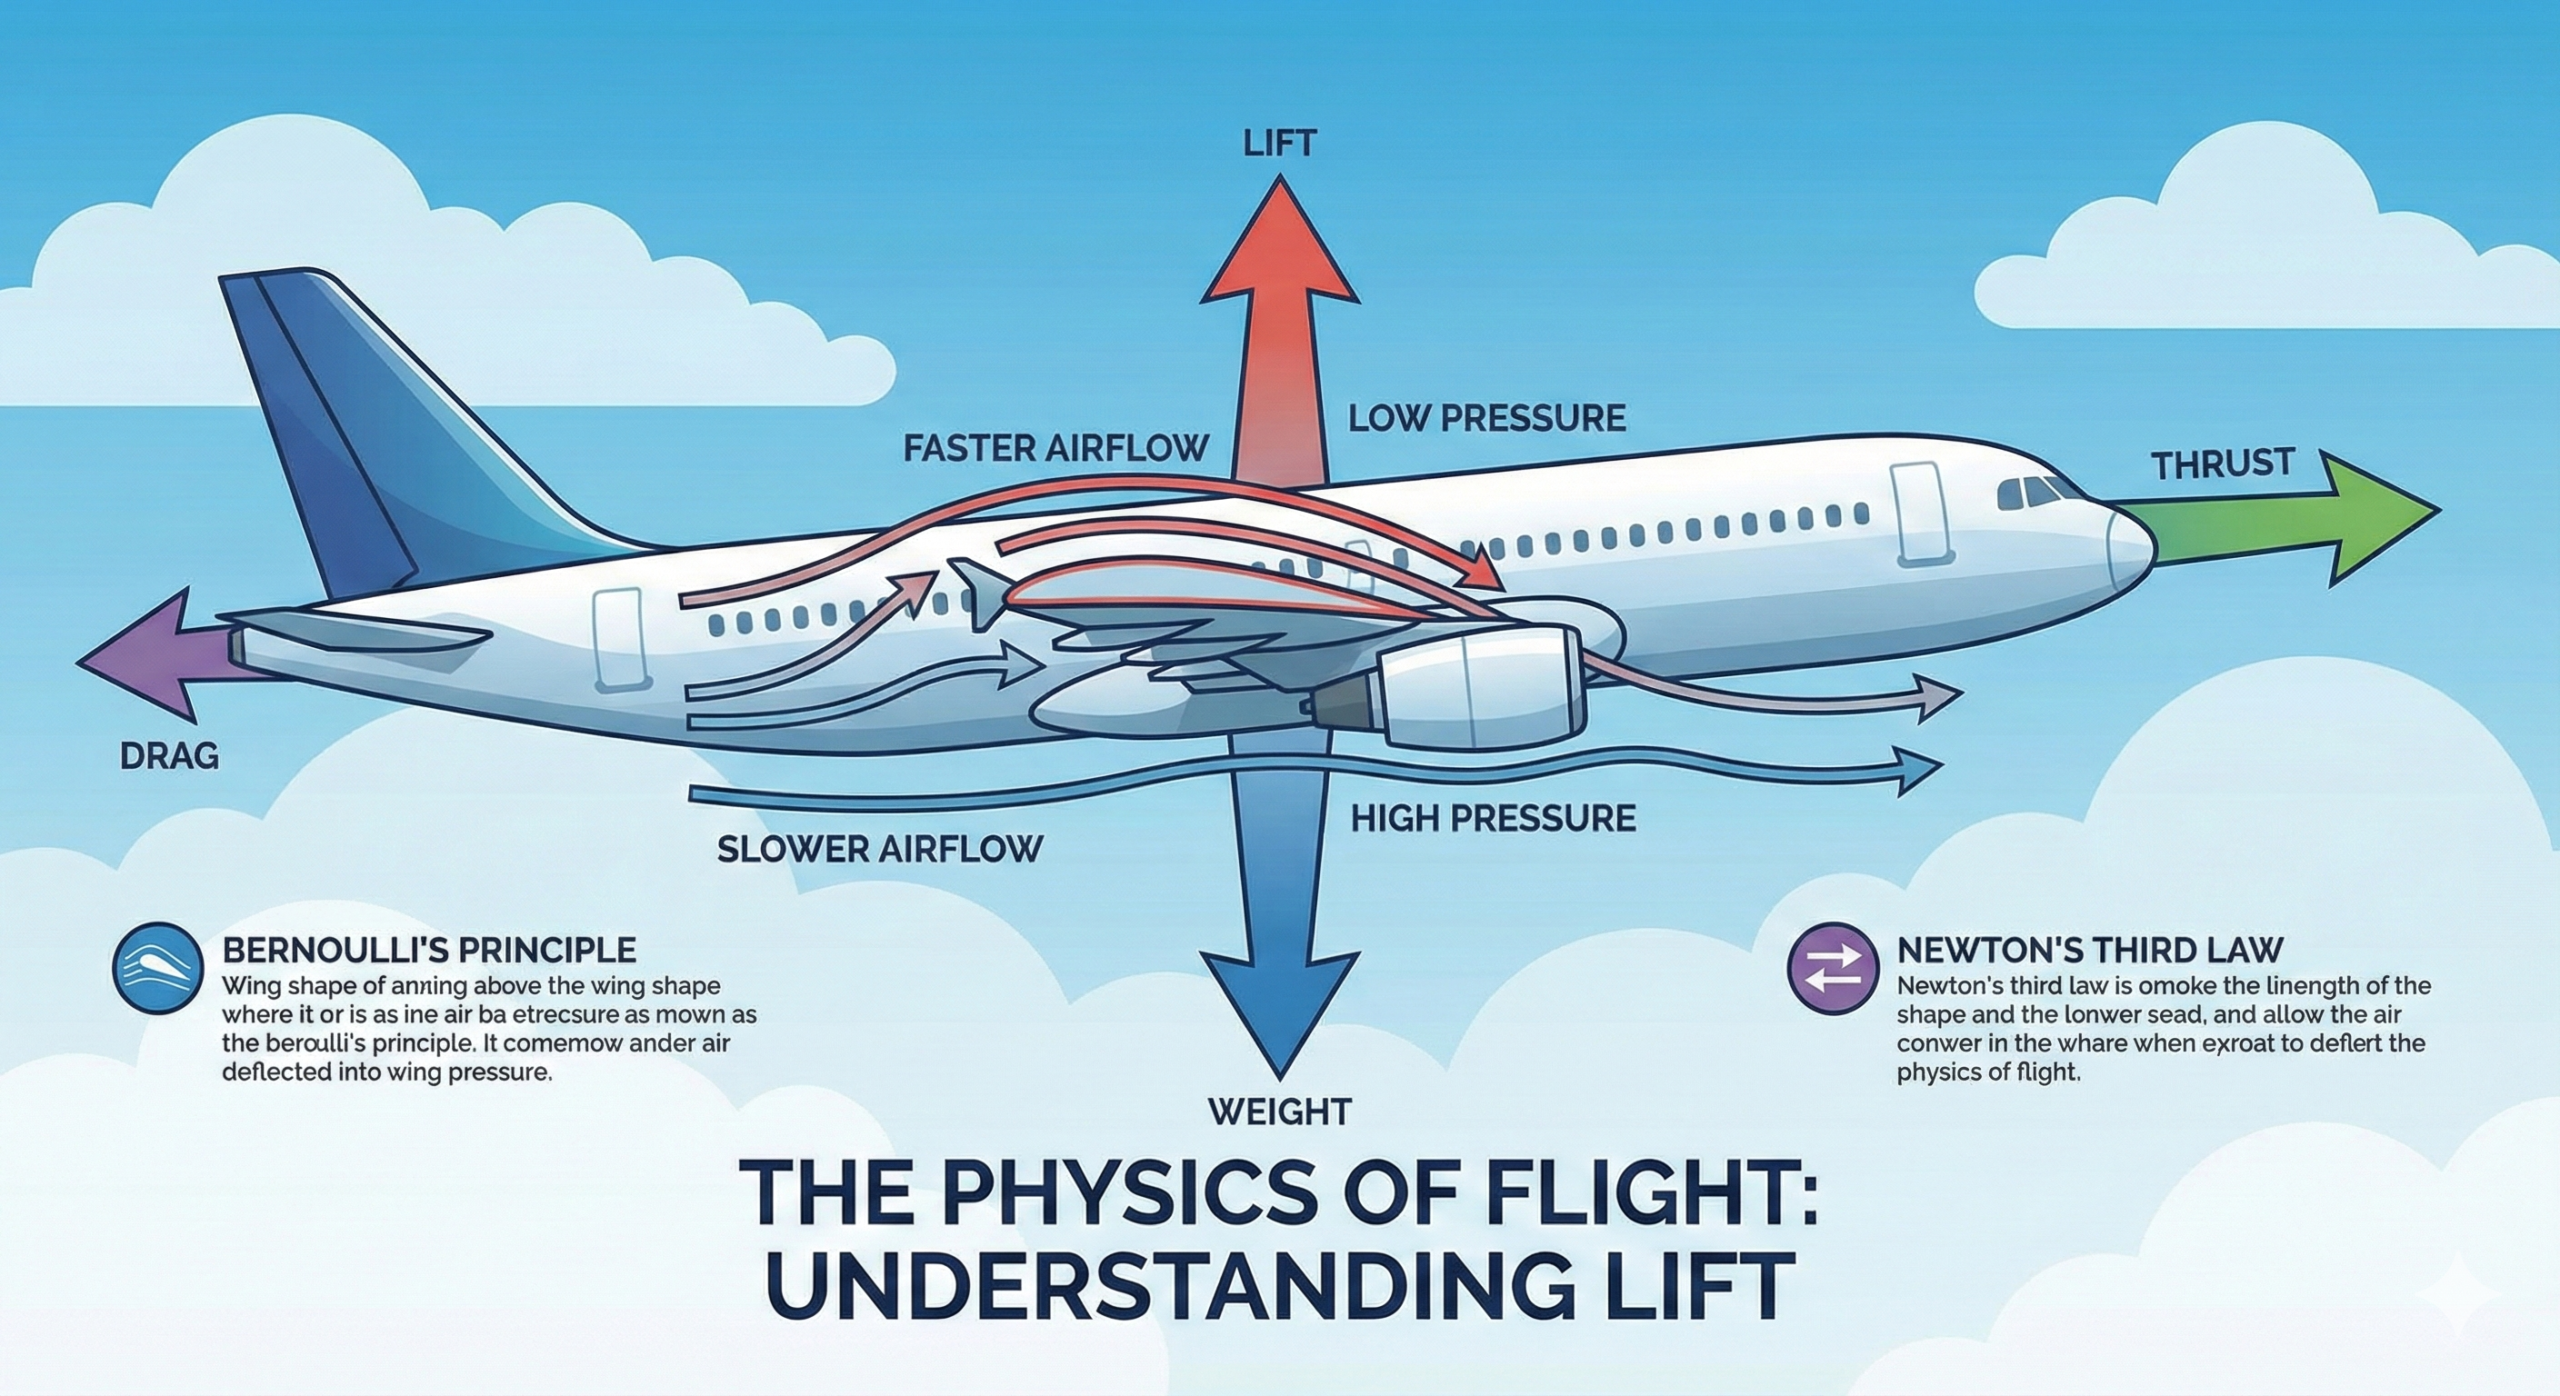
Why Are We Able to Fly Aircraft?
~ Understanding Aviation Safety from a Risk Management Perspective ~
💡 航空機が安全に飛べるのと同様に、品質管理も体系的なリスク管理が基盤です。
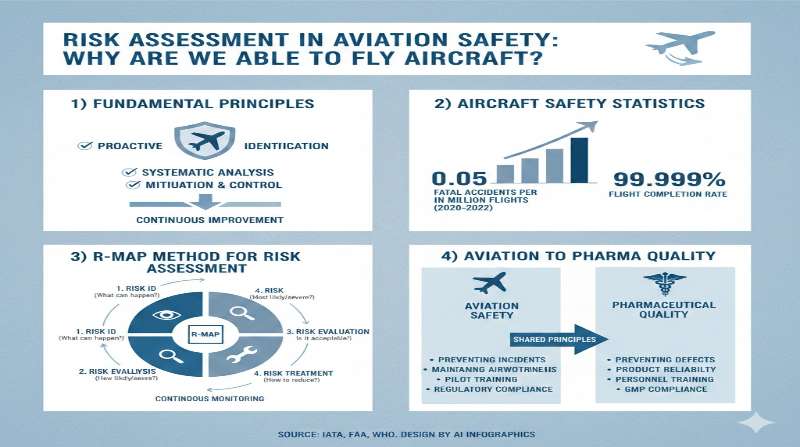
Fundamental Principles of Risk Assessment
When evaluating risks, we consistently employ a comprehensive assessment based on two axes: “Severity” and “Probability.” This approach represents a foundational principle of scientific risk management that has been widely adopted across various fields, including product safety, medical devices, and aviation safety.
Consider the act of boarding an aircraft. Everyone recognizes that if an aircraft were to crash, the consequences would be “Catastrophic”—meaning most passengers and crew would perish in such a tragic event. Yet, why do we still choose to fly? The answer lies in our understanding that the probability of such a crash occurring is extremely low. In other words, while the severity is “Catastrophic,” the probability of occurrence is at an “Incredible” level—meaning it is virtually inconceivable.
Statistical Data Demonstrating Aircraft Safety
Latest Aviation Accident Statistics
According to the most recent research published in 2025 by Professor Arnold Barnett of the Massachusetts Institute of Technology (MIT), the fatality rate from aviation accidents has been improving at approximately double the rate every decade. Specifically, the progression shows:
- 1998-2007: One fatality per 2.7 million boardings
- 2008-2017: One fatality per 7.9 million boardings
- 2018-2022: One fatality per 13.7 million boardings
To express this differently, even if you were to fly every single day, you would encounter a fatal accident only once every approximately 37,500 years. The frequently cited figure of “8,200 years” is based on an analysis by the National Transportation Safety Board (NTSB) from 2001, but current data demonstrates that safety has improved substantially since then.
According to analysis by the Aviation Safety Network, a Dutch aviation safety research organization, as of 2015, flying once per day would result in an accident probability of once every 10,306 years, and this safety record has continued to improve subsequently.
Regional Safety Disparities
Professor Barnett’s research classifies the world into three groups, revealing significant regional differences in aviation safety:
Group 1 (Safest): Japan, United States, EU countries, Australia, Canada, China, and others Group 2 (Moderate Safety): South Korea, Southeast Asian countries, Middle Eastern countries, parts of South America, and others Group 3 (Undergoing Improvement): Other countries
While Group 3 countries show a fatality accident rate 36.5 times higher than Group 1, rapid improvements are being implemented in these regions. Countries in Group 1, including Japan, maintain world-class aviation safety standards.
Comparison with Other Transportation Modes
To properly understand aircraft safety, it is instructive to compare it with other modes of transportation:
Fatality Rates by Transportation Mode (per 10 billion passenger miles):
- Aircraft: 0.01 deaths
- Train: 0.04 deaths
- Automobile: Approximately 7.3 deaths
These figures reveal that automobiles are approximately 730 times more dangerous than aircraft. In fact, approximately 40,000 people die annually in automobile accidents in the United States, whereas commercial aviation fatalities number only a few dozen at most per year, with many years recording zero fatalities.
In Japan, there has not been a single passenger fatality involving large commercial aircraft since the Japan Airlines Flight 123 crash in 1985 (which claimed 520 lives). This 40-year safety record vividly demonstrates the reliability of Japan’s aviation safety system.
Risk Assessment Using the R-MAP Method
What is the R-MAP Method?
The Union of Japanese Scientists and Engineers (JUSE) developed the “R-MAP (Risk Matrix Assessment and Planning) method” as a technique for visualizing risks. Since April 2008, the Ministry of Economy, Trade and Industry has officially adopted this method for risk assessment of product accidents and recall decisions, and its implementation among domestic companies is rapidly expanding.
The R-MAP method visualizes risk using the following matrix:
Vertical Axis: Frequency of Occurrence (6 levels)
- Level 5: Frequent (exceeding 10⁻⁴)
- Level 4: Probable (10⁻⁴ to 10⁻⁵)
- Level 3: Occasional (10⁻⁵ to 10⁻⁶)
- Level 2: Remote (10⁻⁶ to 10⁻⁷)
- Level 1: Improbable (10⁻⁷ to 10⁻⁸)
- Level 0: Incredible (below 10⁻⁸)
Horizontal Axis: Severity of Harm (5 levels)
- Level IV: Critical/Catastrophic (death, permanent disability)
- Level III: Moderate (hospitalization required)
- Level II: Minor (outpatient treatment)
- Level I: Slight injury (product smoke emission level)
- Level 0: No injury (no harm)
These are combined to classify risks into three regions:
- Region A (Red): Unacceptable risk. Immediate countermeasures required
- Region B (Yellow): Conditionally acceptable risk. Risk reduction measures desirable
- Region C (Green): Acceptable risk. Current management adequate
Why Aircraft Flight is Deemed Acceptable Under R-MAP
According to R-MAP evaluation criteria, risks with a frequency of occurrence of 10⁻⁶ (one in a million) or less—that is, “once every 1,000 years or less”—are classified as Region C (acceptable risk), even when the severity is “Catastrophic.”
As mentioned previously, the fatality accident probability for modern commercial aircraft is one per 13.7 million boardings (based on 2018-2022 data). Assuming one boarding per day, this corresponds to approximately once every 37,500 years. This value falls under the “Incredible” level (below 10⁻⁸) in the R-MAP system and is clearly positioned in Region C.
Thus, through scientific and quantitative risk assessment, aircraft flight is determined to be at a socially acceptable risk level.
Indirect Effects Following 9/11: The Risk Perception Paradox
An important lesson in risk management can be found in what is known as the “risk perception paradox” that occurred following the September 11, 2001, terrorist attacks in the United States.
Overview of Research Findings
After the terrorist attacks, many American citizens avoided air travel out of fear of terrorist attacks and instead chose to travel by automobile. This behavioral change resulted in the following research findings:
- Blalock & Simon, Cornell University (2009): An estimated 1,200-2,300 additional automobile accident fatalities occurred during the 12 months following the terrorist attacks
- Gaissmaier & Gigerenzer, Max Planck Institute (2012): An estimated 1,600 additional automobile accident fatalities occurred during the 12 months following the terrorist attacks
These studies suggest that the number of indirect deaths resulting from misperceptions of risk may have rivaled the scale of direct casualties from the terrorist attacks themselves (approximately 2,600 deaths excluding aircraft passengers and crew).
Why Did This Phenomenon Occur?
This phenomenon stems from inherent characteristics of human psychology:
- Availability Heuristic: Dramatic events that remain vivid in memory (terrorist attacks) are perceived as more likely to occur than their actual probability suggests
- Dominance of Fear Response: Emotional fear overrides rational risk assessment
- Lack of Statistical Literacy: Intuitive “feelings of safety” take precedence over objective probability data
Despite the fact that aircraft are far safer than automobiles, the shift to automobiles—which “felt safer”—ultimately claimed many lives.
Lessons from This Case
This case demonstrates that the following points are critical in risk management:
- Evidence-Based Decision Making: Risks should be assessed based on scientific data rather than emotions
- Importance of Risk Communication: Conveying accurate risk information in an understandable manner contributes to improved safety across society
- Recognition of Comparative Risk: Attempting to avoid one risk can lead to taking on a greater risk
Multi-Layered Safety Systems Supporting Aviation Safety
The exceptionally high safety record of aviation is supported by the following multi-layered safety systems:
Technical Safety Measures
Redundancy Design: Critical systems have multiple backups, designed to continue flight even if one component fails. For example, multiple engines are installed, and hydraulic systems are also multiplied.
Fail-Safe Design: When systems fail, they are designed to automatically operate toward the safe side.
Rigorous Testing and Certification: New aircraft must undergo years of stringent testing and certification processes before commencing operations.
Human Factors Countermeasures
CRM (Crew Resource Management): Training programs that optimize communication and cooperation across the entire team of pilots, cabin crew, and maintenance personnel.
Regular Training and Simulator Training: Pilots undergo regular rigorous training to maintain their ability to respond to various emergency situations.
Fatigue Risk Management: Crew duty hours and rest periods are strictly managed to prevent judgment errors due to fatigue.
Organizational Safety Management
SMS (Safety Management System): A systematic system for managing safety across entire organizations, mandated for major airlines since 2018. In April 2024, this requirement was extended to all commercial aviation operators.
FDM (Flight Data Monitoring): Continuous analysis of flight data enables early detection and response to potential risks.
Regulation and Oversight
Stringent Regulatory Standards: International standards established by the International Civil Aviation Organization (ICAO) and strict regulations by national aviation authorities (Japan’s Civil Aviation Bureau of the Ministry of Land, Infrastructure, Transport and Tourism; the FAA in the United States).
Continuous Auditing and Inspection: Airlines and maintenance operators undergo regular audits to verify compliance with standards.
Accident Investigation and Learning: When aircraft accidents occur, transportation safety boards (such as the NTSB and JTSB) conduct thorough investigations, and lessons learned are shared across the entire industry.
Future Challenges and Prospects for Aviation Safety
New Technological Challenges
Urban Air Mobility (UAM): Ensuring the safety of new aviation transportation modes, such as so-called “flying cars” and drone taxis, presents ongoing challenges.
Automation and Autonomous Flight Technology: As AI technology advances, higher levels of automation are being introduced, while new risks must also be considered.
Cybersecurity
As aircraft systems become increasingly networked and digitized, countermeasures against cyberattacks are gaining importance.
Balancing Sustainability
Achieving both environmental impact reduction and safety represents a crucial theme for the future of the aviation industry.
Conclusion
The reasons why aircraft are socially “permitted to fly” result from the comprehensive interaction of the following factors:
- Scientific Risk Assessment: Quantitative risk assessment using methods such as R-MAP has demonstrated that the accident probability of aircraft is at an “acceptable” level
- Continuous Safety Improvement: Through technological innovation, enhanced training, and organizational safety management, aircraft safety continues to improve at approximately double the rate every decade
- Multi-Layered Safety Systems: Multiple safety layers—technical, human, organizational, and regulatory—function in an overlapping manner
- Transparency and Learning Culture: A culture of learning from accidents and incidents and sharing lessons across the industry has been established
When evaluating risks, it is essential that we base our judgments on scientific data rather than emotions. The case of increased automobile accidents following the 9/11 terrorist attacks serves as a sobering lesson on how errors in risk perception can lead to serious consequences.
Aircraft represent one of the safest modes of transportation that humanity has developed. This safety has been achieved through the efforts of countless individuals and the accumulation of continuous improvements, and further enhancements are anticipated in the future.
References and Key Concepts
R-MAP (Risk Matrix Assessment and Planning): A risk visualization method developed by the Union of Japanese Scientists and Engineers (JUSE), officially adopted by Japan’s Ministry of Economy, Trade and Industry since 2008 for risk assessment of product accidents.
SMS (Safety Management System): A systematic approach to managing safety that includes organizational structures, accountabilities, policies, and procedures. Required for Part 121 air carriers since 2018, and extended to all Part 135 operators in 2024.
CRM (Crew Resource Management): Training programs focused on interpersonal communication, leadership, and decision-making in the flight deck and cabin.
Aviation Safety Statistics Sources: Data referenced from NTSB (National Transportation Safety Board), MIT research (Professor Arnold Barnett), Aviation Safety Network, and various peer-reviewed academic studies.
Risk Assessment Standards: ISO 10377 (Consumer product safety—Guidelines for suppliers), IEC 61508 (Functional safety of electrical/electronic/programmable electronic safety-related systems), and related international standards.
📌 関連テンプレート: リスク管理キット(品質システムテンプレート集)
Related FDA QMSR Templates
Streamline your FDA QMSR compliance with our professionally crafted templates: